
FOR NEWLY APPOINTED HOSPITAL CHIEF EXECUTIVES
Know your market deeper than anyone competing for it.
MAPS+ · Marketing and Positioning Strategy
Integrates market, competitive, consumer and operational data into a single set of findings — and a roadmap for growth — delivered within 60 to 90 days.
How the organization compares with each competitor on identical criteria. Where volume is out-migrating from the service area and what portion is recoverable. How the community perceives the organization. And a sequenced plan for acting on all three.
60-90
days to a board-ready plan
11
integrated components
1
comparative view of the field

Market knowledge and market analysis are different assets
Chief executives arrive with substantial knowledge of their markets. Many have worked in them for years; others join from competing organizations in the same region or nationally. That knowledge is an asset, and MAPS+ is designed to build on it rather than replace it.
MAPS+ provides the comparative layer. It benchmarks the organization against every competitor on identical criteria within the same time frame. It measures how much volume out-migrated from the primary service area in a given year and identifies the service lines to which it moved. And it establishes community brand sentiment through anonymous, independently fielded research rather than through what the market will say directly to the organization.
These are measurement gaps rather than knowledge gaps. They are also, consistently, where the findings that most affect a growth plan are located.
A chief executive’s knowledge combined with MAPS+ data creates a powerful intelligence platform. Analysis is the competitive factor.
Request your market overview
Tell us about your organization and we will outline what MAPS+ would examine in your market.
Timing affects how the findings are received and how freely a leader can act on them
An independent assessment commissioned within the first ninety days is generally understood within an organization as diligence. What it identifies is treated as an inherited condition, and it carries no implied judgment of the current team.
The same assessment conducted eighteen months into a tenure tends to be read differently: as an evaluation of decisions already made, including decisions the chief executive approved.
Commissioning the work early therefore provides both better information and greater freedom to act on it.
The engagement
MAPS+ is Marketing and Positioning Strategy

Findings are not delivered as isolated reports. Market share, competitive benchmarking, consumer research and operational review are analyzed together, because each materially changes how the others should be read.
Onspire Health Marketing translates business strategy into executable strategy that strengthens the brand, supports growth and enables the organization to scale.
Where this sits
MAPS+ does not replace a strategic plan. It often informs one, and it brings one to life.
Enterprise strategy establishes where to grow, which service lines to prioritize, and whether the economics support the decision. It stops at the recommendation. MAPS+ begins there: it determines how the market is persuaded to choose you and produces the plan that captures the volume those targets assume.
ENTERPRISE STRATEGY
Where to grow
Service line priorities, partnership and capital decisions, and the financial case for each. Set by your board, your internal strategy function, or a strategy consultancy.
MAPS+
How the market chooses you
Market position, competitive benchmarking, outmigration analysis, community sentiment, and the activation plan that captures the targeted volume.
ONSPIRE HEALTH MARKETING
Execution
Brand, digital, AI visibility and media that deliver the plan, with ongoing monitoring and an annual MAPS+ refresh.
A strategy engagement already underway is not a reason to defer this work. It is the most productive moment to begin it.
What integrated analysis contributes
Four capabilities that no organization can produce from internal data alone, regardless of how well it understands its market.
01
Benchmark the competitive landscape
Your position measured against each competitor on identical criteria and within the same time frame: bed size, population trends, HCAHPS, online reputation, social listening, service line presence and paid media investment. A single methodology applied across the full competitive set is the element no organization can assemble from internal data alone.
02
Understand how the market perceives you
Independent consumer research establishing your Net Promoter Score and the community’s perceptions of affordability, quality, access, trust, brand and employment. Surveys are fielded online and all responses are anonymous, which is what allows the findings to reflect what the market believes rather than what it will say directly to the organization.
03
Quantify the growth opportunity
Market share analysis measuring the volume leaving your service area, identifying the service lines to which it moves, and establishing what portion is realistically recoverable, with primary service area recommendations to focus the effort.
04
Establish the plan — and execute it
A defensible brand position, the brand summarized on a single page, operational and marketing findings, and a sequenced activation plan with the investment required. Onspire Health Marketing then runs the brand, digital and media work that delivers it. Advisory firms stop at the recommendation.
Eleven components. One roadmap.
MAPS+ collects and analyzes an extensive set of market data and resolves the integrated findings into a single data-driven roadmap for growth. Each component addresses a question that bears directly on the decisions ahead of you.
National landscape
Which pressures are ours, and which are industry-wide?
National trends set against organizational performance, distinguishing conditions specific to your market from those affecting the sector as a whole.
Competitive landscape analysis
How do we compare with others competing in this market?
Benchmarking against each competitor on identical criteria: bed size, population trends, HCAHPS, online reputation, social listening, key service lines and paid media investment.
Target audience profile
How is our service area changing?
Population and demographic analysis projecting how the service area and its needs shift over the next five years.
Market share analysis
Where is volume leaving the market, and what is recoverable?
Outmigration, leakage, inpatient and outpatient, service line opportunity and primary service area recommendations.
Consumer survey & NPS
How does the community perceive us?
Independent research establishing a baseline for loyalty and for perceptions of affordability, quality, access, trust, brand and employment. Surveys are fielded online and all responses are anonymous.
Leadership input session
Is the leadership team aligned on direction?
A facilitated session that engages the executive team in shaping the findings and creates an aligned, shared vision for the organization.
Position, promise & commitment
What position can we credibly own?
A defensible competitive position and a brand promise the organization is equipped to deliver consistently.
Brand atlas
Can the organization articulate one consistent position?
The brand summarized on a single page for the board, staff, medical staff, recruiters and every partner who represents the organization.
Operational considerations
What operational factors are constraining growth?
Access, scheduling, capacity and referral considerations that influence growth, so investment is not directed toward demand the organization is not yet positioned to absorb.
Marketing considerations
Is marketing investment directed at the right opportunities?
Recommendations derived from the integrated findings rather than from prior channel allocation.
Implementation & budget plan
What are we asking the board to approve?
A sequenced activation plan with the investment required, the order of operations and the expected contribution of each phase.
Market share analysis assumes client approval of data access.
The clock a new chief executive is actually running
Year 2
Is when boards begin to expect movement in the metrics, according to Spencer Stuart’s framework for chief executive tenure
50%
Of transformation value typically materializes within the first 18 months, per McKinsey research
111
Hospital chief executive departures in 2025 — a 7 percent increase over 2024, with 74 more through June 2026
41%
Of rural hospitals operate with a negative margin, and 417 are vulnerable to closure
Spencer Stuart describes year one as the launch period: the time to diagnose the problem and set priorities. MAPS+ compresses that diagnosis into the first quarter, which leaves the remainder of year one available for action rather than analysis.
View sources
- Hospital chief executive departures, 2025 and 2026 year to date — Challenger, Gray & Christmas, reported by Becker’s Hospital Review and Challenger, Gray & Christmas.
- Interim appointment share, first half 2025 — Challenger, Gray & Christmas, reported by HealthLeaders Media.
- Rural hospital operating margins and closure vulnerability — Chartis, 2026 Rural Health State of the State.
- Patient use of online reviews — rater8, How Patients Choose Their Doctors, 1,008 U.S. adults.
- Hospital-first selection behavior — U.S. News & World Report survey of 500 U.S. adults, reported by TechTarget.
- Chief executive tenure framework and transformation timing — Spencer Stuart and McKinsey research, reported by Becker’s Hospital Review, September 2, 2026.
Questions new chief executives ask us
I already know this market well. What will this tell me that I do not know?
Typically less about the shape of the market and considerably more about its magnitude. In most engagements the analysis confirms the chief executive’s existing view on several points and attaches a defensible figure to each for the first time, which is what allows those views to be presented for funding. Where genuine surprises occur, they are usually narrow and specific: outmigration in a service line exceeding internal estimates, a competitor investing in a category not previously tracked, or a perception gap visible only in independent survey data.
We have a strategy firm engaged. Should we wait until that work concludes?
That is generally the most productive moment to begin. Enterprise strategy establishes where to grow and whether the economics support it; MAPS+ determines how the market is persuaded to choose you and builds the plan that captures the volume those targets assume. The two are sequential rather than substitutes, and a strategy engagement already underway means the direction MAPS+ translates into market activity is already defined.
Will bringing in an outside firm this early send the wrong signal internally?
In practice, the opposite tends to be true. A leadership input session is built into the engagement specifically so the executive team participates in shaping the findings rather than receiving them. Leaders consulted early in the process are considerably more likely to support the plan that results from it.
We already have a strategic plan. Why do this?
MAPS+ establishes whether its assumptions still hold. Many plans currently in market were developed against pre-2023 assumptions about volume, workforce, payer mix and consumer behavior. Validating an existing plan is a legitimate and comparatively inexpensive outcome, and it is a common one.
We have internal analytics. What does MAPS+ add?
Internal analytics describe activity within the organization. MAPS+ addresses the external environment: volume that never presented, competitors the organization is not benchmarked against, and community perceptions that cannot be self-reported. Data is also frequently viewed in silos rather than integrated and holistically, which is what obscures the opportunity. The two are complementary, and the engagement is designed to work alongside existing internal reporting.
Ninety days seems fast for this much analysis. How?
The timeline is achievable because the methodology and data sources are already established. MAPS+ applies a defined process to your market rather than designing a study from the beginning, which is where most of the time in a comparable engagement is otherwise spent.
Is this a marketing plan?
No. Marketing recommendations are one of eleven components. The market share analysis, consumer research and operational findings stand on their own and regularly inform decisions regarding service area, service line investment and capital allocation.
Sample deliverable
What a MAPS+ deliverable looks like
A walkthrough of a complete engagement using Sample Regional Health, a representative independent regional system. It shows the analysis, the strategy it produced, and the plan it ended in.
Illustrative only · not an actual client
The subject and the evidence base
~375
licensed beds
5
counties
20+
care locations
60+
years
7yrs
years of market share trend data
~400
consumer survey responses ·
Syndicated
secondary research
Leadership
input session
Where the volume sits
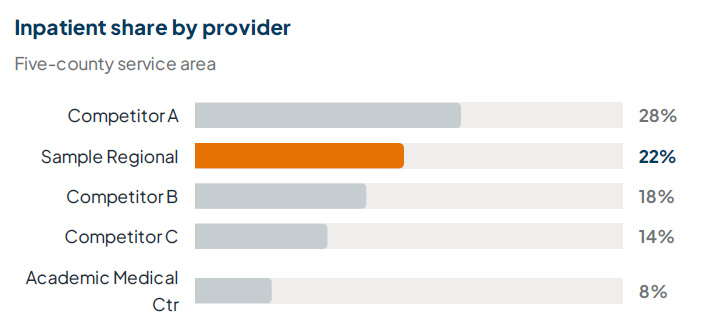
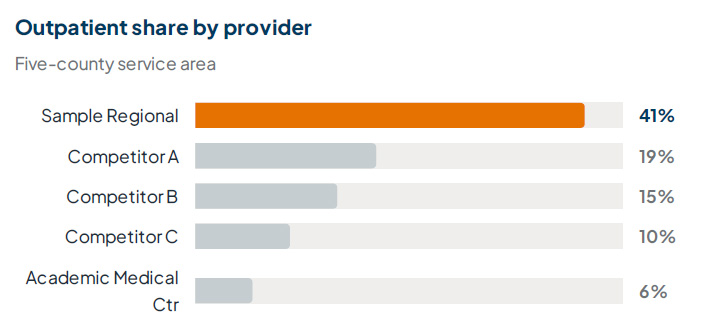
The finding. Second in inpatient, clear leader in outpatient, with inpatient softening — which makes outpatient the growth engine
What the community said
44
NET PROMOTER SCORE
Six points above the healthcare benchmark of 38 — meaningful loyalty among current patients and a base to build advocacy on. Quality and convenience drove the choice of hospital above every other factor besides insurance. First-choice preference was strong in emergency, primary care, imaging and maternity, and trailed in cardiology and cancer, where patients still left the region. Those two gaps became the clearest service-line growth targets.
How the field compared
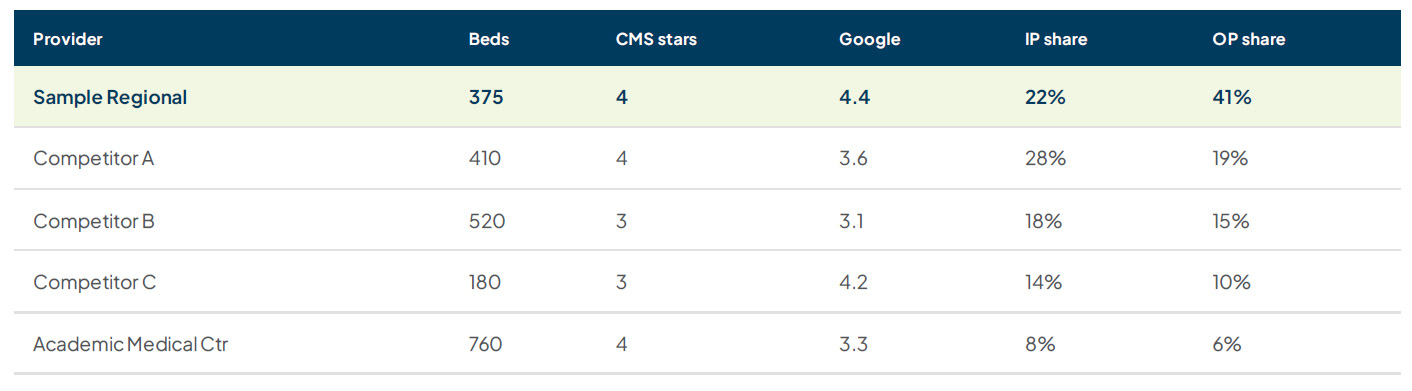
Smallest is not weakest. Sample Regional leads outpatient share and rates highest with patients despite having fewer beds than three of the four competitors.
The strategy it produced
Position
The region’s health partner of choice for families seeking proactive, accessible, whole-person care.
Brand promise
To inspire every member of every family to choose vibrant, healthy living, and to make that choice easy, close to home.
1
Patient experience
Whole-person, family-centered care across every touchpoint.
2
Access and convenience
Multiple locations, extended hours, simplified scheduling.
3
Quality and trust
Recognized clinical excellence and a strong community reputation.
4
Service-line growth
Focused marketing where outpatient demand is rising.
The plan it ended in
Q1
Brand foundation
Brand refresh launch, reputation management setup, website discovery.
Q2
Service-line push
Priority service campaigns, awareness building, provider content.
Q3
Audience expansion
Digital and social, community engagement, two-generation targeting.
Q4
Measure and optimize
Survey re-fielding, tactical refinement, year-two planning.
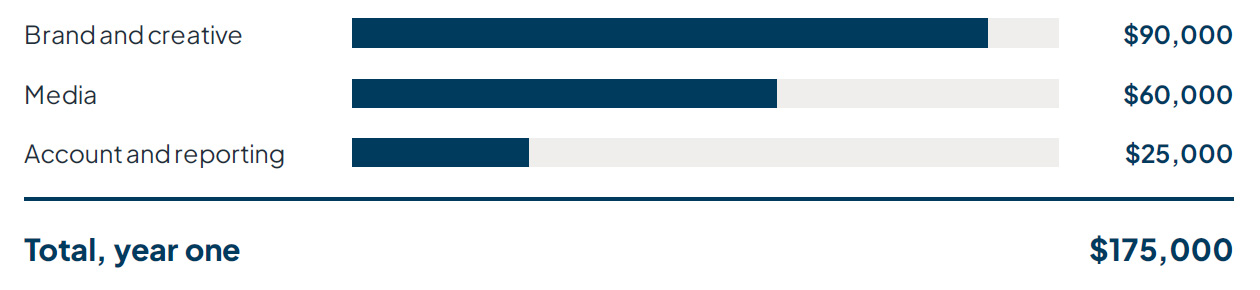
Media is planned and approved separately. The figure shown is the strategy, creative and account investment for the first year of activation, and is illustrative rather than a quoted price.
Every name, figure and finding in this walkthrough is illustrative and does not represent an actual client.
Proof
And two real engagements
Both were delivered inside the 60 to 90 day window. Both ended in a funded, sequenced plan that the client’s own team now owns and runs.
Regional health system · approximately 400 beds
Where internal data and independent research disagreed
The situation. The clear market leader across a multi-county service area, holding the large majority of both inpatient and outpatient volume at home. Internal patient-experience data placed the system near the top of the industry.
What MAPS+ found. An independent community survey of roughly 384 residents returned a Net Promoter Score well below benchmark. Preference was driven by convenience rather than loyalty. Residents described the system as accessible and, in their own words, disconnected. Seven years of trend data showed inpatient share softening while outpatient share grew.
Why it mattered. The care was already excellent; the perception had not caught up. That is a communications problem rather than a capability problem, and the two call for very different investments. No internal source could have surfaced it.
What followed. A repositioning around responsible regional leadership, a program to close the perception gap, a unified brand and website, internal engagement and recruitment work, and service-line campaigns focused on outpatient growth — phased across the year with the investment laid out.
Independent community hospital · 25 beds
Where the loyalty was, and where it was not yet
The situation. A 25-bed independent hospital serving a four-county market on the edge of a major metro, with more than 55 years in the community and deep loyalty among older patients.
What MAPS+ found. Leading outpatient provider in its county and second for inpatient care. The highest patient ratings of any system nearby, despite being the smallest by bed count. A Net Promoter Score of 42 against a 38 industry benchmark — but 55 among patients aged 65 and older and only 33 among younger patients. Cancer care and cardiology were routinely going to an academic center 30 to 65 miles away.
Why it mattered. Younger families are the future of the hospital’s volume and were also the audience with the most room to grow. The analysis located both the gap and the service lines where recovery was realistic.
What followed. A brand refresh reflecting the full network, investment in women’s health and the birth center, imaging, orthopedics and cardiology, and a two-generation communications approach — a year-one activation plan of approximately $175,000.
Footnote: Both engagements are anonymized at the client’s request. Full case study reports are available on request and are attached to the market overview follow-up.
Why the regional system leads. Order these deliberately. The perception-gap finding is the single best piece of evidence in the entire campaign, because it demonstrates the measurement-gap premise rather than asserting it: the organization’s own data said one thing, independent research said another, and only the second was actionable. A chief executive who reads that paragraph understands what MAPS+ does without needing the rest of the page.
From first conversation to board-ready plan
Week 1
Scope
A working session to define your market, your competitive set, and the service lines that matter most. We confirm data access and set the timeline.
Weeks 2–8
Collect and analyze
Market and competitive data collection, consumer research fielding, market share analysis, and your leadership input session.
Weeks 9–12
Deliver
Findings, brand position, brand atlas, operational and marketing considerations, and your sequenced activation plan — presented to you and, when you are ready, to your board.
From there
Execute
Onspire Health Marketing runs the brand, digital, AI visibility and media work that delivers the plan, with ongoing monitoring and an annual MAPS+ refresh. This step is the separation from advisory-only firms and belongs on the timeline, not in a footnote.
Sixty to ninety days from engagement to a board-ready plan.
Know your market before your competitor does.
A 30-minute conversation about your market, your competitive set, and what MAPS+ would measure. If the engagement is not the right fit or the timing is not right, we will say so.
Request your market overview
Tell us about your organization and we will outline what MAPS+ would examine in your market.

© 2026 Onspire Health Marketing. All Rights Reserved.